K-Means Clustering for Customer Segmentation
 >Estimated reading time: ~10 minutes # K-Means Clustering for Customer Segmentation
Objectives
- Use scikit-learn’s k-means clustering to cluster data
- Apply k-means clustering on real world data for customer segmentation
Introduction
K-means is widely used for clustering in data science applications, especially for discovering insights from unlabeled data. Applications include customer segmentation, pattern recognition, and feature engineering.
Import the required libraries
import numpy as np
import pandas as pd
import matplotlib.pyplot as plt
from sklearn.cluster import KMeans
from sklearn.datasets import make_blobs
from sklearn.preprocessing import StandardScaler
import plotly.express as px
%matplotlib inline
import warnings
warnings.filterwarnings('ignore')
K-Means on a synthetic data set
np.random.seed(0)
X, y = make_blobs(n_samples=5000, centers=[[4,4], [-2, -1], [2, -3], [1, 1]], cluster_std=0.9)
plt.scatter(X[:, 0], X[:, 1], marker='.',alpha=0.3,ec='k',s=80)
Setting up k-means
k_means = KMeans(init = "k-means++", n_clusters = 4, n_init = 12)
k_means.fit(X)
k_means_labels = k_means.labels_
k_means_cluster_centers = k_means.cluster_centers_
Visualize the clusters
fig = plt.figure(figsize=(6, 4))
colors = plt.cm.tab10(np.linspace(0, 1, len(set(k_means_labels))))
ax = fig.add_subplot(1, 1, 1)
for k, col in zip(range(len([[4, 4], [-2, -1], [2, -3], [1, 1]])), colors):
    my_members = (k_means_labels == k)
    cluster_center = k_means_cluster_centers[k]
    ax.plot(X[my_members, 0], X[my_members, 1], 'w', markerfacecolor=col, marker='.',ms=10)
    ax.plot(cluster_center[0], cluster_center[1], 'o', markerfacecolor=col,  markeredgecolor='k', markersize=6)
ax.set_title('KMeans')
ax.set_xticks(())
ax.set_yticks(())
plt.show()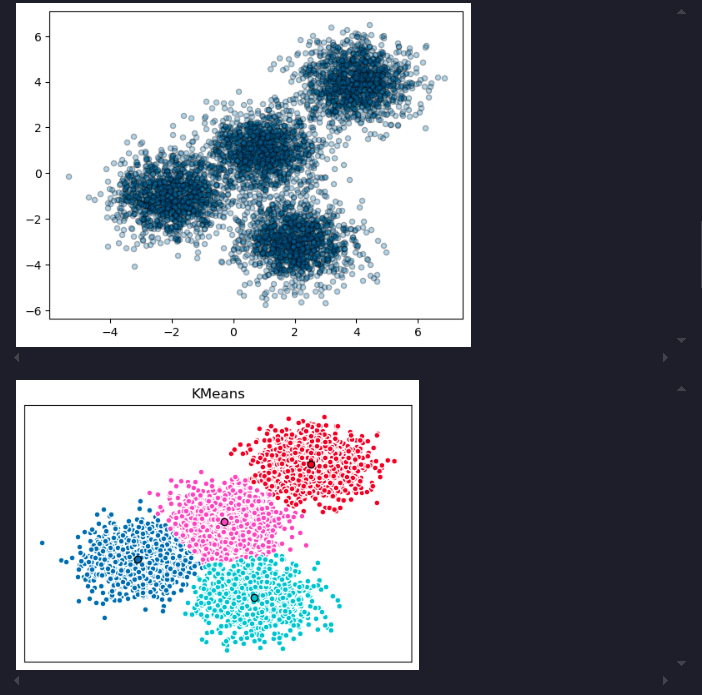
Customer Segmentation with k-means
cust_df = pd.read_csv("https://cf-courses-data.s3.us.cloud-object-storage.appdomain.cloud/IBMDeveloperSkillsNetwork-ML0101EN-SkillsNetwork/labs/Module%204/data/Cust_Segmentation.csv")
cust_df = cust_df.drop('Address', axis=1)
cust_df = cust_df.dropna()
X = cust_df.values[:,1:]
Clus_dataSet = StandardScaler().fit_transform(X)
clusterNum = 3
k_means = KMeans(init = "k-means++", n_clusters = clusterNum, n_init = 12)
k_means.fit(X)
labels = k_means.labels_
cust_df["Clus_km"] = labels
Visualize customer clusters
area = np.pi * ( X[:, 1])**2
plt.scatter(X[:, 0], X[:, 3], s=area, c=labels.astype(float), cmap='tab10', ec='k',alpha=0.5)
plt.xlabel('Age', fontsize=18)
plt.ylabel('Income', fontsize=16)
plt.show()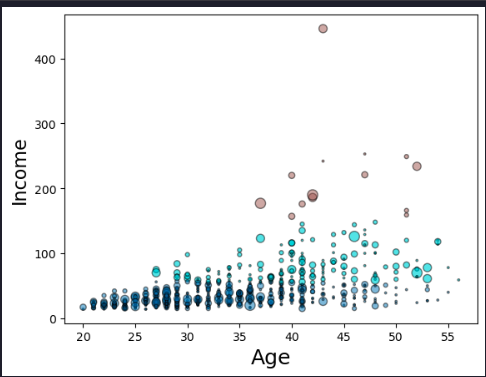
We can also see this distribution in 3 dimensions for better understanding. Here, the education parameter will represent the third axis instead of the marker size.
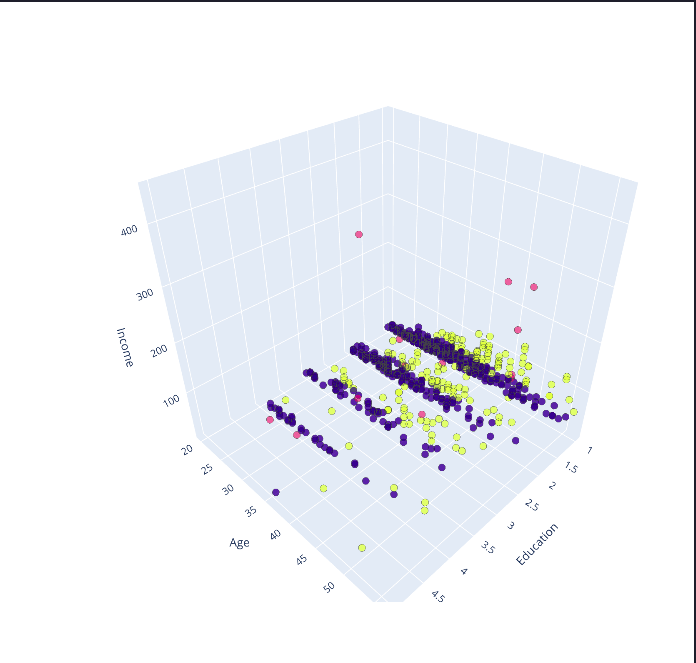
k-means will partition your customers into mutually exclusive groups, for example, into 3 clusters. The customers in each cluster are similar to each other demographically.
Summary
This article demonstrated how to use k-means clustering for customer segmentation, including synthetic data and real-world customer data.